“Built an agentic workflow in 3 minutes using Claude Cowork to automate hours of data fetching, analysis, and insights.”
…
…
Catchy, right?
But that’s not how it actually happened.
I spent the first few days understanding the system of record in SAP—figuring out which reports truly mattered for analyzing material movements: vendor receipts, utilization, transfers, and stock positions.
Then came another layer of effort—understanding relationships between fields, decoding what each column really meant, and identifying which metrics actually reflect business logic.
Only after that groundwork did I start building:
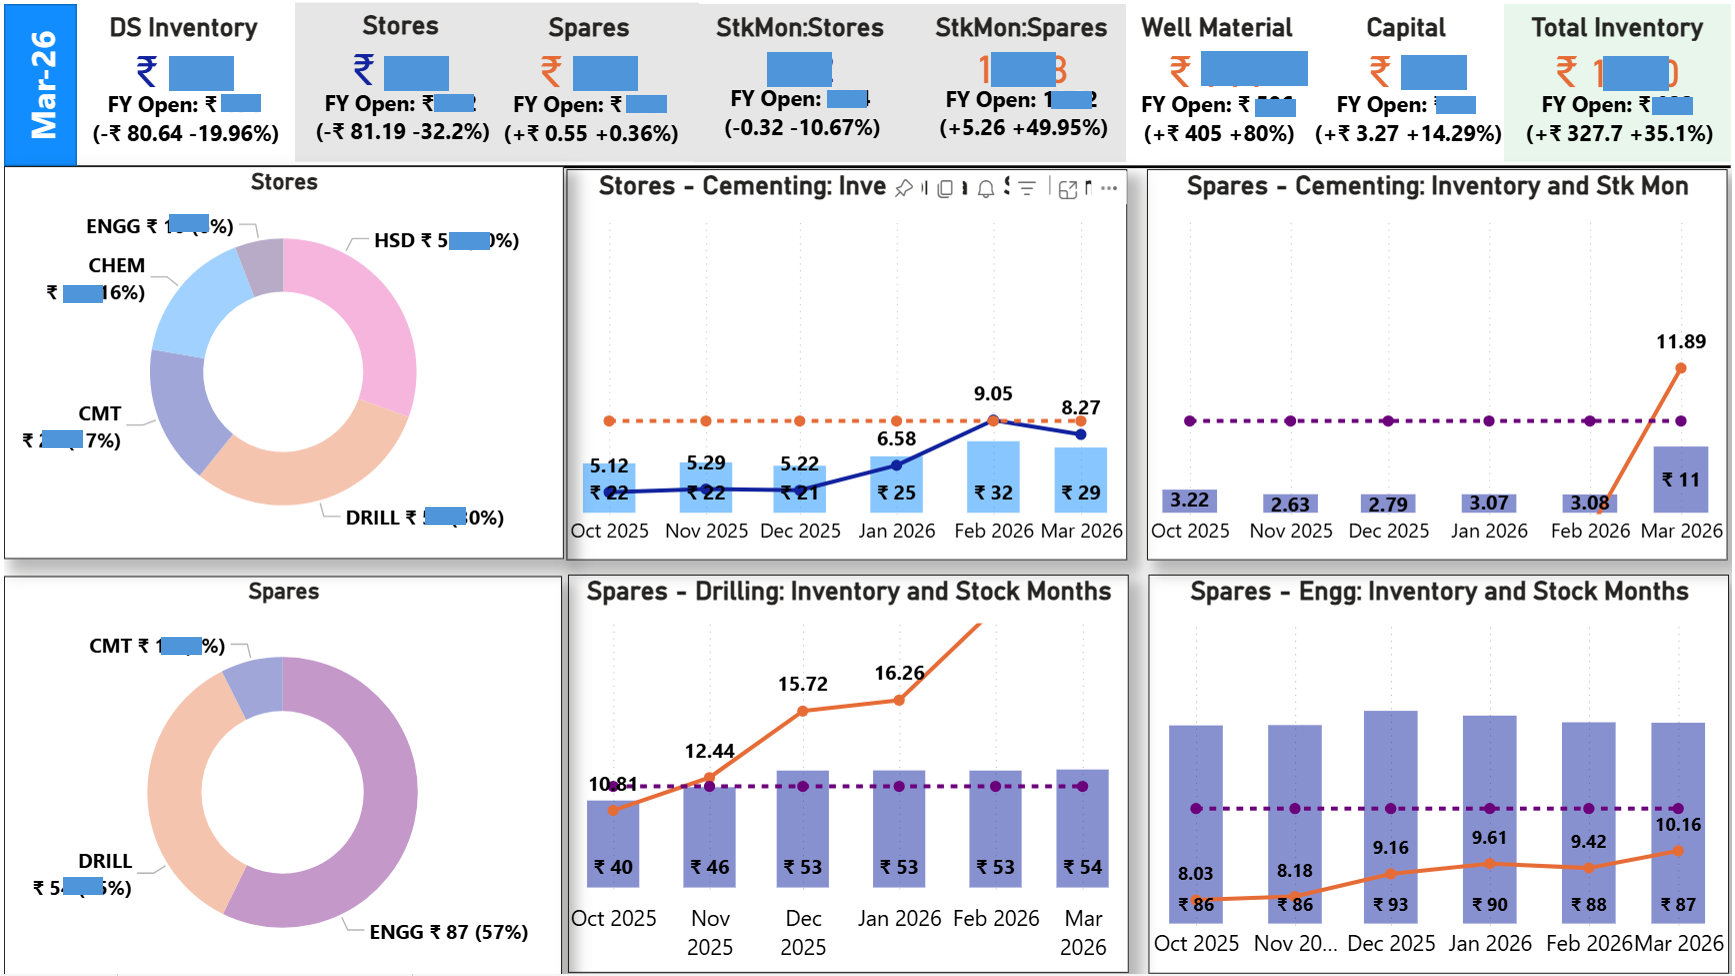
– M code for data cleaning and preprocessing
– DAX for calculated metrics
– Visuals in Power BI
Here’s how the data flow works:
SAP → Power Automate → SharePoint → Power BI (via Microsoft Fabric scheduled refresh)
But that isn’t the end.
I review the report regularly—page by page—to validate outputs, identify gaps, and look for areas where intervention can improve business outcomes. That’s where the real work happens: deciding what to act on and how.
Once the system is set up, updating it with new data takes minimal effort.
But the thinking, planning, and strategizing with it—that part doesn’t get automated.
This isn’t about rejecting or endorsing AI-driven workflows.
It’s about recognizing that tools can accelerate execution, but understanding the business logic and making decisions with insights from the data—that’s still on us.